FIGURE 1. Comparative view of four fossil teleosaurid crocodylomorphs used in the regression analyses: (1) Steneosaurus bollensis GPIT/RE/1193/2; (2) Steneosaurus priscus MNHN.F CNJ 78a; (3) Steneosaurus bollensis MH unnumbered A; and (4) Steneosaurus bollensis MH unnumbered B. Scale bars equal 100 cm.
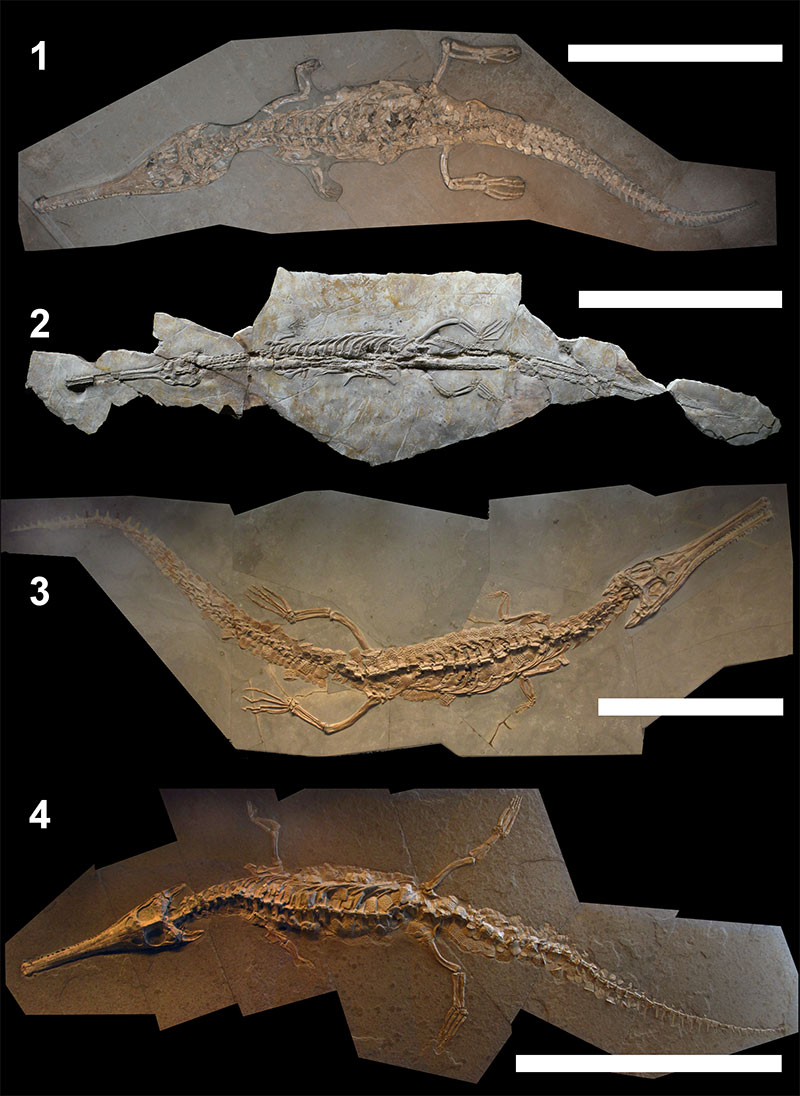
FIGURE 2. Comparative view of three fossil thalattosuchian crocodylomorphs: (1) teleosaurid Platysuchus multiscrobiculatus SMNS 9930; (2) basal metriorhynchoid Pelagosaurus typus MTM M62 2516; and (3) metriorhynchid Cricosaurus suevicus SMNS 9808. Scale bars equal 50 cm.
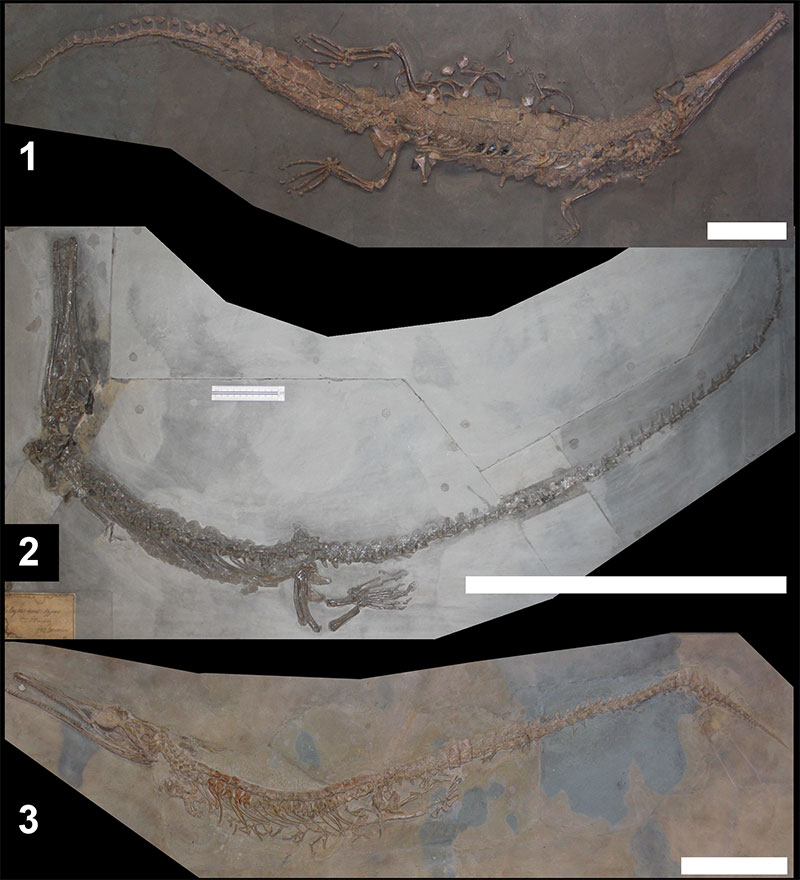
FIGURE 3. Bivariate plots of cranial (1, 3) and femoral lengths (2, 4) plotted against total lengths for complete specimens only (1, 2) and for all specimens (3, 4). In each case a line of least-squares regression is fitted along with a shaded area representing the confidence interval around the regression model.
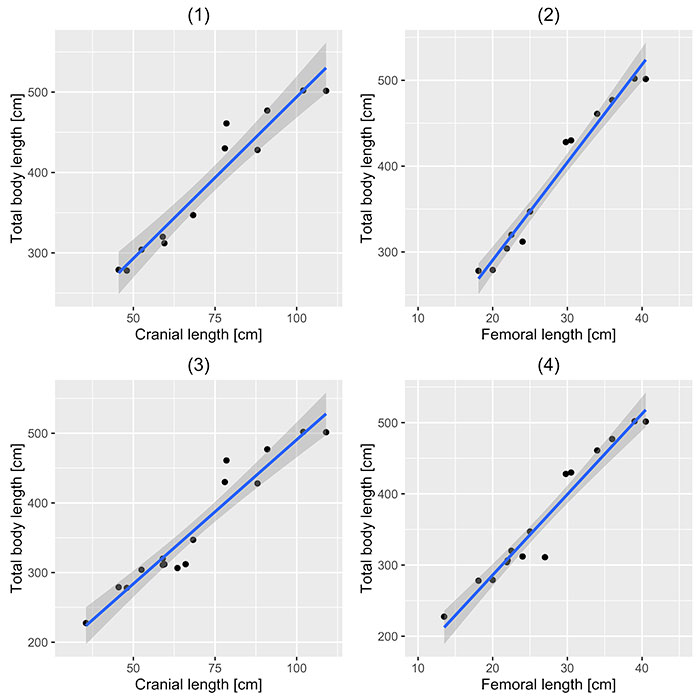
FIGURE 4. Comparative least-squares regression gradient plot, of cranial length-to-total length, with the solid line representing Teleosauridae, and the dashed lines representing (1) Crocodylus, (2) Alligator, (3) Gavialis, and (4) Metriorhynchidae, respectively.
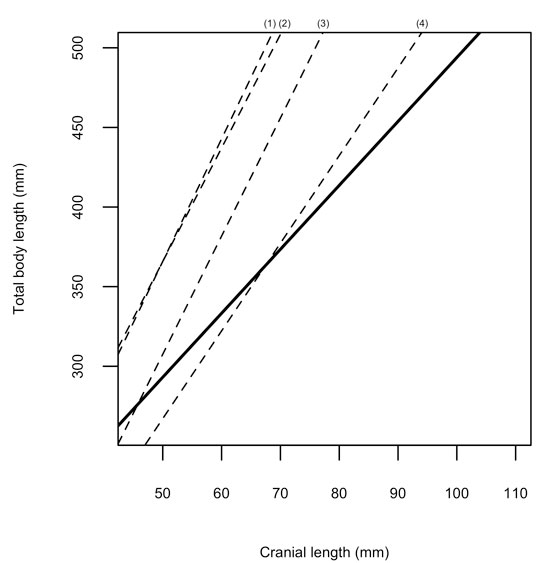
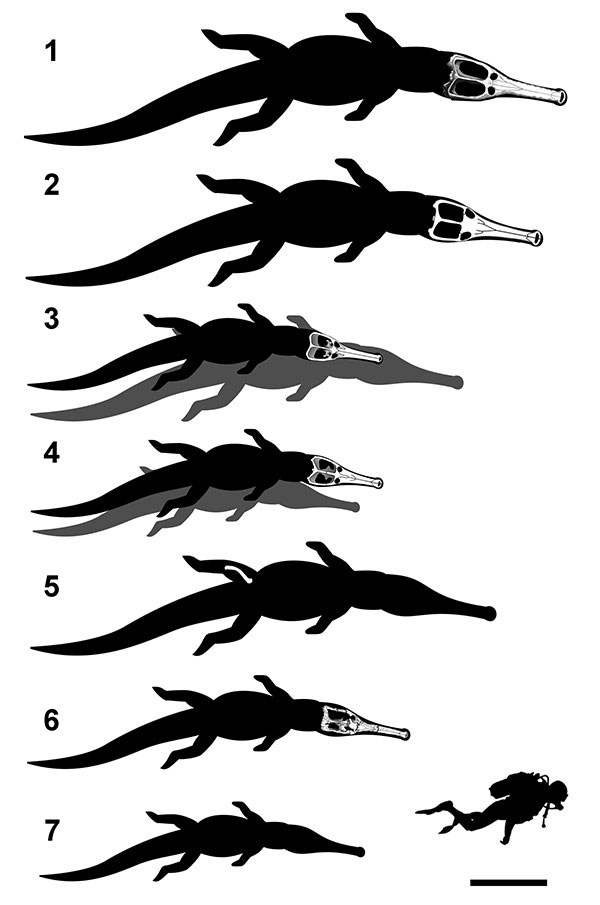
FIGURE 5. Comparative view of estimated body length of large-bodied teleosaurids (see Table 8). (1) Machimosaurus rex (holotype); (2) Machimosaurus hugii (referred specimen from Krebs, 1968); (3) Machimosaurus mosae (neotype, grey silhouette is the lost holotype); (4) Machimosaurus buffetauti (holotype, grey silhouette is the specimen from Buffetaut, 1982b); (5) Steneosaurus edwardsi (referred specimen from Johnson et al., 2015); (6) Steneosaurus obtusidens (holotype); (7) Steneosaurus bollensis (based on MH unnumbered A). The skull drawings are modified from (Fanti et al., 2016 and Young et al., 2014). Scale bar equals 1 m.