

FIGURE 1. Different developmental stages of Carcinus maenas under fluorescent and natural light, modified after Braig et al. 2023b. A: Dorsal view of megalopa under fluorescent light (car_29G; Appendix 1). B: Dorsal view of juvenile under fluorescent light (car_2C; Appendix 1). C: Dorsal view of adult under natural light (Oliver Mengedoht/Panzerwelten.de, Recklinghausen), source image did not contain a scale. D: Dorsal view of young adult under natural light (Oliver Mengedoht/Panzerwelten.de, Recklinghausen), source image did not contain a scale.

FIGURE 2. Scheme of the methodology. Step 1 (s1): Half of the shield outline is reconstructed from source image in dorsal view. Step 2 (s2): The half of the shield is then duplicated and mirrored in anterior-posterior axis and stitched together to form an entire symmetric shield. Step 3 (s3): The shield is registered in R using the Momocs package with 1493 +/- 259 coordinates for the Carcinus data set and 3053 +/- 1736 coordinates for the Liocarcinus data set.
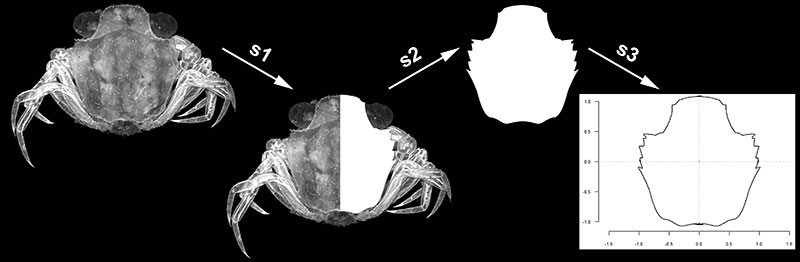
FIGURE 3. Morphospace of the data created by the principal component analysis on the elliptic Fourier analysis of the Carcinus maenas data set, created by plotting PC1 and PC2 of the PCA against each other. Included shapes depict graphical component loadings for each PC.

FIGURE 4. Morphospace of the data created by the principal component analysis on the elliptic Fourier analysis of the Liocarcinus data set, created by plotting PC1 and PC2 of the PCA against each other. Included shapes depict graphical component loadings for each PC.

